This tool calculates various descriptive statistics on a set of samples stored in a text file: mean, median, variance, standard deviation, confidence interval around the mean and median. It can also produce an histogram of the samples. In that case, be careful at the step value used, since this parameter may dramatically change the results.
This tool can be either used interactively (the user must answer two questions then), or automatically (which is usefull to launch the tool recursively on all files of a directory). For instance you can use:
find trace_dir -name *.trc -print -exec descr_stats 1 {} noninter\;
which will call descr_stats for all files whose name has a ".trc"
extension in the "trace_dir" directory and its sub-directories,
taking into account the data present in the first column.
If you are not familiar with the various notions, please read this document.
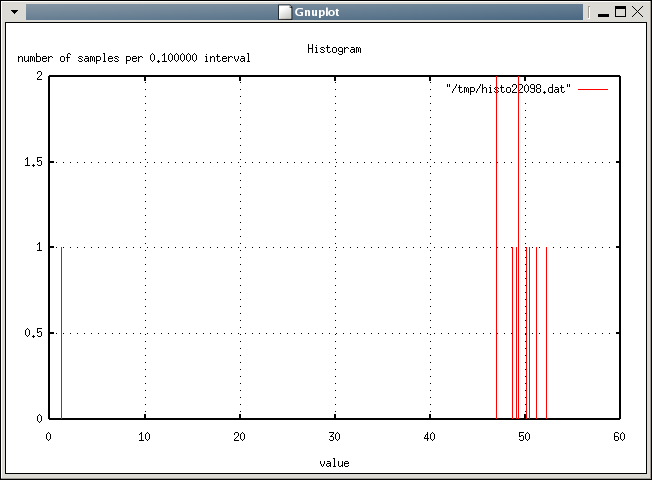
Here is a simple demo. The data file contains the following samples:
$ cat ~/tmp/test_val
1.1
49
50
49.2
49.224
47
48.5
51.0
50.3
46.9
52.1
And here are the results of running our descr_stats tool:
$ ~/work/descr_stats/descr_stats 1 ~/tmp/test_val
        ------------------------------------------------------
        nb of samples = 11
        mean = 44.938545
        median = 49.200001
        variance = 213.801060
        standard deviation = 14.621938
        range = 51.000000        min = 1.100000  max = 52.099998
        confidence interval around mean 44.938545:
                90: +/- 43.838547
                95: +/- 43.838547
                99: +/- 43.838547
        confidence interval around median 49.200001:
                90: +/- 2.899998
                95: +/- 48.100002
                99: +/- 48.100002
	------------------------------------------------------
Continue with histogram (produces a gnuplot .dem format) (y/n)[n] ? y
Enter sampling step (real number > 0.0): 0.1
histogram data file is:         /tmp/histo22098.dat
histogram gnuplot file is:      /tmp/histo22098.dem
The histo*.dem file can then be given to gnuplot to produce the
histogram.
$ gnuplot /tmp/histo22098.dem
Hit return to continue
and here is the histogram: